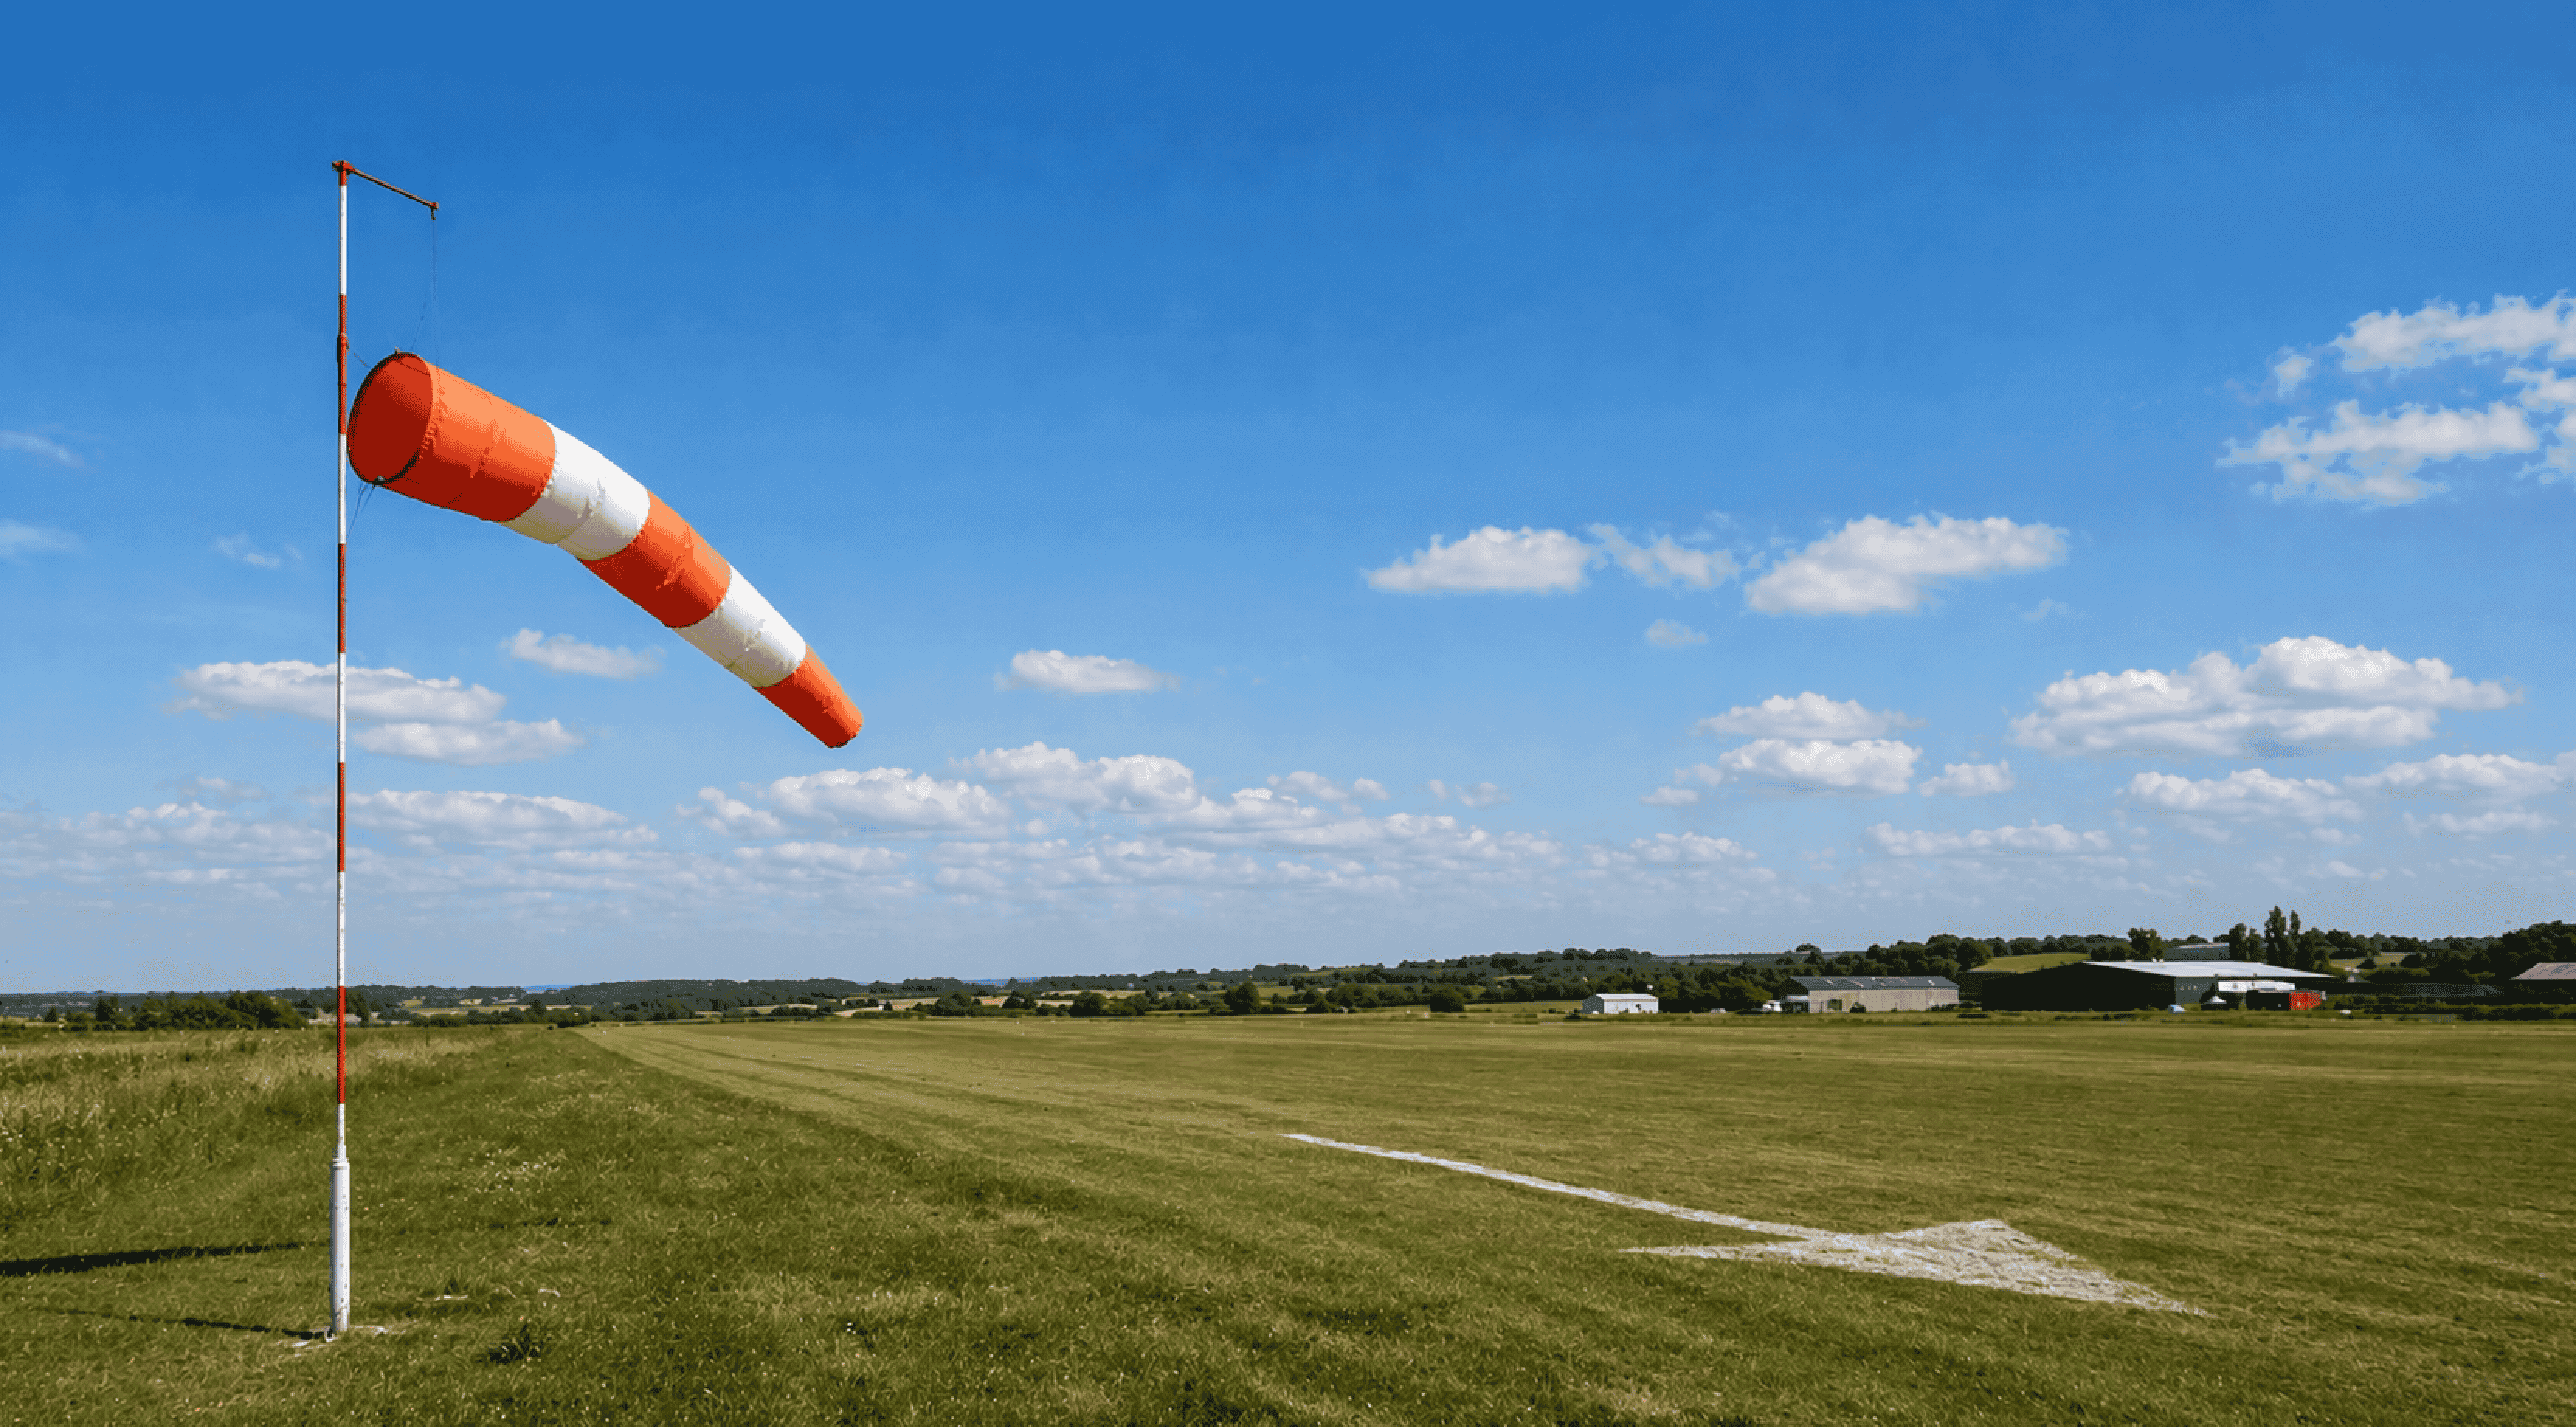
You checked the forecast last night. Clear skies, wind 8 knots, beautiful. You set an alarm, drove two hours, pulled up at the DZ car park and watched a 20-knot crosswind send a windsock horizontal.
The app wasn't broken. It just wasn't looking at the same place you were standing.
Welcome to microclimates. The reason smart skydivers don't just check the weather, they learn to read their specific dropzone like a second language.
What Actually Is a Microclimate?
A microclimate is a localised atmospheric condition that differs from the surrounding regional weather. Not by a little, sometimes dramatically.
Temperature, humidity, wind speed, wind direction, cloud base, turbulence all of them can behave completely differently within a few kilometres of the "official" reading your app is pulling.
That reading? It comes from the nearest weather station, which might be a town 12 miles away, at a different elevation, in a valley, surrounded by buildings. It's measuring that location. Not yours.
The UK is particularly well set up to make this a pain in the rear risers.
Varied topography, a coastline that punches well above its weight on local wind patterns, and a climate that can produce genuinely different conditions within a single county. What's working at Netheravon might be a marginal call at Headcorn on the same afternoon.
The Main Culprits
Valley Effects
Valleys are microclimate factories. During the day, valley floors heat up faster than the surrounding high ground, creating rising air and unpredictable thermals. In the evening, the reverse happens, cold air drains downslope and pools at the bottom, sometimes producing ground fog or a temperature inversion that caps cloud base well below what the regional forecast suggested.
If your DZ sits in or near a valley, or the approach to it crosses one, you can have conditions at altitude that look nothing like what's happening at ground level. A stable, cloud-free day on paper can have rotor turbulence sitting invisibly below ridgeline on the exit side.

Coastal and Sea Breeze Effects
Sea breeze fronts are one of the most misread phenomena in UK outdoor sports forecasting. On warm, sunny days with light synoptic winds, the temperature difference between the land and sea triggers a pressure gradient. Cool air from the sea pushes inland, often dramatically changing surface wind direction and speed, and it does it at a time of day (mid-afternoon) when you'd otherwise expect perfect jump conditions.
Headcorn in Kent is a case study in this. Positioned in the Weald, relatively close to both the English Channel and the Thames Estuary, the DZ can experience sea breeze interactions driven by land–sea thermal contrast, shifting conditions noticeably from the morning.
A south-easterly sea breeze pushing inland from the Channel doesn't always show up clearly in regional forecasts, especially those based on inland reference points like Maidstone or Canterbury.
Coastal DZs in Scotland and northern England face similar dynamics from a different direction, onshore flows off the North Sea can develop independently of the larger synoptic wind pattern, particularly on warm, clear days.

Orographic Effects (What Mountains Do to Wind)
Orographic forcing is what happens when wind hits terrain and has to go over, around, or through it. The air accelerates, descends and warms on the lee side (Foehn effect), or stacks up into rotor turbulence below ridgelines.
For skydivers, the clearest example in the UK is anything near the Lake District or the Pennines. Black Knights Parachute Centre in Lancashire sits east of the Lake District fells. When westerlies push through, the wind that arrives at the DZ isn't the clean regional westerly, it's been through the hills first. The surface reading in Preston tells you almost nothing about what's happening at 4,000 feet above the DZ on a day with gradient from the west.
Urban Heat Islands
Less dramatic for most DZs, but worth knowing. Large urban areas run measurably warmer than surrounding rural land, which affects thermic activity, humidity, and, in summer, the likelihood of convective cloud development over the city that can spread outward. If you're trying to read whether cumulonimbus is going to build over the next few hours, understanding what's upstream matters.
Agricultural and Surface Effects
Open agricultural land, think the flat Lincolnshire and Nottinghamshire plains around Hibaldstow and Langar, heats very efficiently under direct sun, creating strong, predictable thermic activity in summer afternoons. Great for glider pilots. Relevant for skydivers because it drives convective cloud development faster than the forecast models, built on 12-hour grid data, will capture. You can watch cumulus build in real time in a way that a morning forecast won't predict.
Why Forecast Models Miss This
National and regional forecast models (the ones powering most weather apps) run on grids — squares of land where the model makes one prediction per cell. The resolution of these cells ranges from a few kilometres to tens of kilometres depending on the model and subscription tier of the app you're using.
A 10km grid cell is a lot of terrain. It might include a river valley, an exposed ridge, and a town. The model averages across all of it. What it produces is useful for broad planning. It is not useful for knowing whether the crosswind at your specific DZ is going to be 8 or 18 knots at 2pm.
High-resolution models do exist, and some weather services use them. But even the best publicly available forecasting has limits at the hyper-local level. Which is why the most reliable person to ask about microclimate behaviour at any specific DZ is an experienced jumper who's been there for years and watched the patterns repeat.
How to Get Better DZ-Specific Weather Data
Talk to the staff. This is genuinely the most underrated tool in skydiving weather literacy. Manifest staff and instructors at any established UK DZ have seen hundreds of go/no-go decisions. They know which wind directions tend to produce rotor turbulence on their approach, when the sea breeze typically hits, and what "looks fine on the forecast but never actually is" means for their specific patch of sky. Use them.
Check multiple models. No single forecast source is authoritative. Cross-reference the broad synoptic pattern (pressure systems, fronts) with whatever high-resolution surface data you can get for the DZ's grid coordinates. Disagreement between models is a flag, not a reason to pick the more optimistic one.
Look at METARs for nearby airfields. METAR reports from airfields within 15–20 miles are often the closest thing to real observed conditions you'll get. They report actual wind readings, cloud base in feet, and visibility, not a model's prediction of them. The CAA and NOAA both publish these.
Watch the sky, not the screen. Cumulus development, cloud base changes, and wind shifts at ground level are real data. If the forecast says 2,000ft cloud base and you're watching the bases drop, trust your eyes.
Arrive early. Obvious, maybe, but getting to the DZ an hour before you planned to jump gives you time to watch how the conditions are actually behaving rather than making a 2-hour drive decision based on last night's model run.
The Bigger Picture
Microclimates are one reason why good skydiving weather literacy isn't just about knowing what numbers mean, it's about knowing your specific environment. A pilot who's been flying out of Strathallan for a decade has a mental model of how Highland weather behaves over that particular stretch of Perthshire that no app can replicate.
That knowledge is earned by watching, asking, and jumping in a range of conditions. The app gets you in the car. Local knowledge gets you on and then out of the plane.
If you're still building your forecast literacy, our guide to reading a wind forecast is the right place to start, it covers the layered structure of wind from surface to altitude and what you're actually looking for on jump day.
Once you can read a forecast and understand why your DZ might deviate from it, the next skill is knowing which combinations of those readings should make you pause. That's what we cover in the next article: When not to send it, spotting a sketchy forecast